Photosynthetically Active Radiation and is measured with a PAR meter such as the Apogee MQ-200 which has become commonplace in the industry.
PAR meters measure the amount of light in a small area and extrapolate it out to a useable number. A PAR meter measures light in the wavelengths between 400nm and 700nm. This is very useful in our quest for beautiful reef tanks as our photosynthetic inhabitants rely heavily on these wavelengths as we will show you later in the article.
When measuring PAR levels of LED fixtures one has to understand the limits of the meter itself. According to Apogee’s specs PAR meters underestimate or over-estimate the amount of light depending on wavelength being measured.
Figure 1.1 shows the amount of error and is directly from the Apogee website.

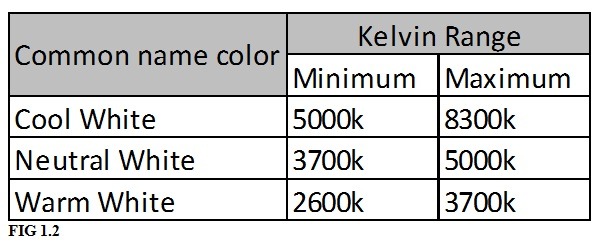
It is very important to understand that the names Cool White, Neutral White and Warm White represent a certain kelvin range in industrial lighting. In figure 1.2 you can see the typical kelvin ratings that are used in the lighting industry for these different types of white.
While these have become commonplace in aquarium fixtures as of late, the experienced hobbyist or industry professional should be asking themselves why would companies use such low kelvin LEDs. Typical metal halide bulbs used in the industry range from 10,000k to 20,000k. So why would companies use such low kelvin white LEDs? The answer is simple, availability and cost. Most companies are using off the shelf LEDs from manufacturers as CREE, Bridgelux, Phillips and Luxeon. While name brands can be useful to know they do not tell the whole story. It’s more important to know the specifics of the LED as shown in a spectrograph. Sourcing LEDs with higher kelvin and a specific spectrum adds cost and time to the production of lights. It is far simpler to install LEDs that are already available from other industry uses. While this may be the easy and cheap path, it is not the ideal situation for coral growth or color.
Lower kelvin lighting is also typically higher PAR because it has a higher amount of Red and Green light in it that is overstated by the PAR meter even though the overall light source is underestimated. A higher kelvin light source will have lower PAR because it has more of the blue spectrum in relation to the red and green to offset the measured amount.
Knowing the PAR levels in your tank after your lights have been installed and intensities set will give you the ability to place corals in locations that are best suited to their needs. Higher light corals such as SPS do well in 200-400 PAR, while many LPS corals prefer less light (50-200 PAR). Soft corals usually prefer lower amounts of par (25-125). These parameters are not set in stone but knowing the PAR levels in your tank will allow you to place new corals in a spot that will likely allow them to thrive.
PAR does not tell the whole story. We need to be just as concerned with the spectral quality of our lights. In fact, corals kept at lower PAR of the ideal spectrum will do better than corals kept at higher PAR of a poor spectrum. You have to think of it as food, if you eat large amounts of junk food, is it better for you than small amounts of good food? No, it’s worse for you and your body will not be as healthy. Light is food for corals and giving them high quality light should be our top priority.
This is where spectrographs and Chromaticity charts come to be needed. A spectrograph is basically a map of the total amount of light a given source is putting out. Spectrographs are pretty basic to understand. At the same time a Chromaticity chart is equally as useful. The two combine to give you the tools necessary to evaluate a light source. It’s important to note that charts provided by the manufacturer of the actual diode are only remotely useful when evaluating a fixtures overall performance. Companies should share the spectrograph of the total fixture as well as individual channels and even single LEDs. Think of this as a list of ingredients, after all, light is food.
In figure 1.3 you can see the spectrograph for the Atlantik v2.1 with all channels on at 100%. The spectrograph shows the total amount of light at each nanometer. The intensity is shown on the left. There should be peaks at the points that corals need and valleys at the points that they don’t need as much.
INSERT V2.1 SPECTROGRAPH AND CHROMATICITY HERE
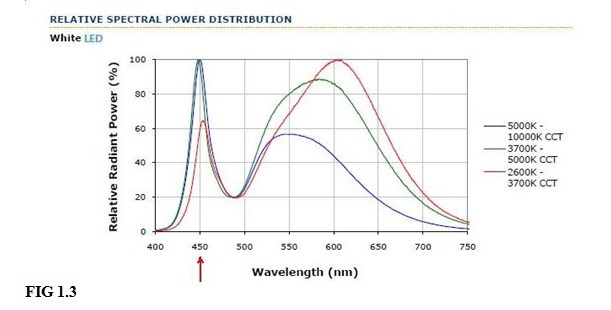
Comparing the ratio of these peaks versus the valleys will give you an understanding of how well a light adheres to the needs of corals. It is good to have the peaks at the right spots but if the valleys are still half as big as the peaks then the overall effectiveness of the light source is reduced. Figure 1.3 shows the average spectrogram for Cool White (blue line), Neutral White (green line) and Warm White (red line). As you can see in all three cases the intensity of the light above 500nm is high when compared to the intensity of the light at 450nm. In the case of the warm white you can see that the intensity of the 450 nm peak is 60% when compared to the peak at 610nm.
So, what do corals need? In this article from Advanced Aquarist, Dana Riddle shows us that the zooxanthellae algaes in coral respond to different wavelengths with higher rates of absorption and thus produce more food for corals. Designing a fixture that caters to these wavelengths and reduces the amount of wasted light is critical to the results that a fixture will produce. Figure 1.4 shows the approximate action spectrum of a porites coral. This shows you which wavelengths are the most efficient at promoting photosynthesis and therefore best for the corals. A fixture matching this spectrum may produce good results but it also has to be balanced with the looks of the corals and fish. The right balance of LEDs will give a pleasing look to the tank and its inhabitants. This is accomplished through the use of our high kelvin white LEDs which we can use in a higher ratio than other fixtures that have to use larger amounts of blue LEDs to offset lower kelvin white LEDs that give a yellow color to the tank.

As you can see, knowing the PAR levels in your tank is a useful tool that will help you to manage the overall ecosystem more intelligently. In order to use it to compare fixtures it must be used in conjunction with the spectrograph and Chromaticity chart. These three tools combined can give you an edge in producing a beautiful reef tank that will be a wonderful example of the stewardship that the hobby can bring.
Installed my Orphek Atlanitk V2 with wifi not quick a month ago and I am already seeing healthier corals, more brilliant lighting, and awesome wifi control. The product itself is great, and the customer service is second to none.
ReplyDelete